

Au rez de chaussée
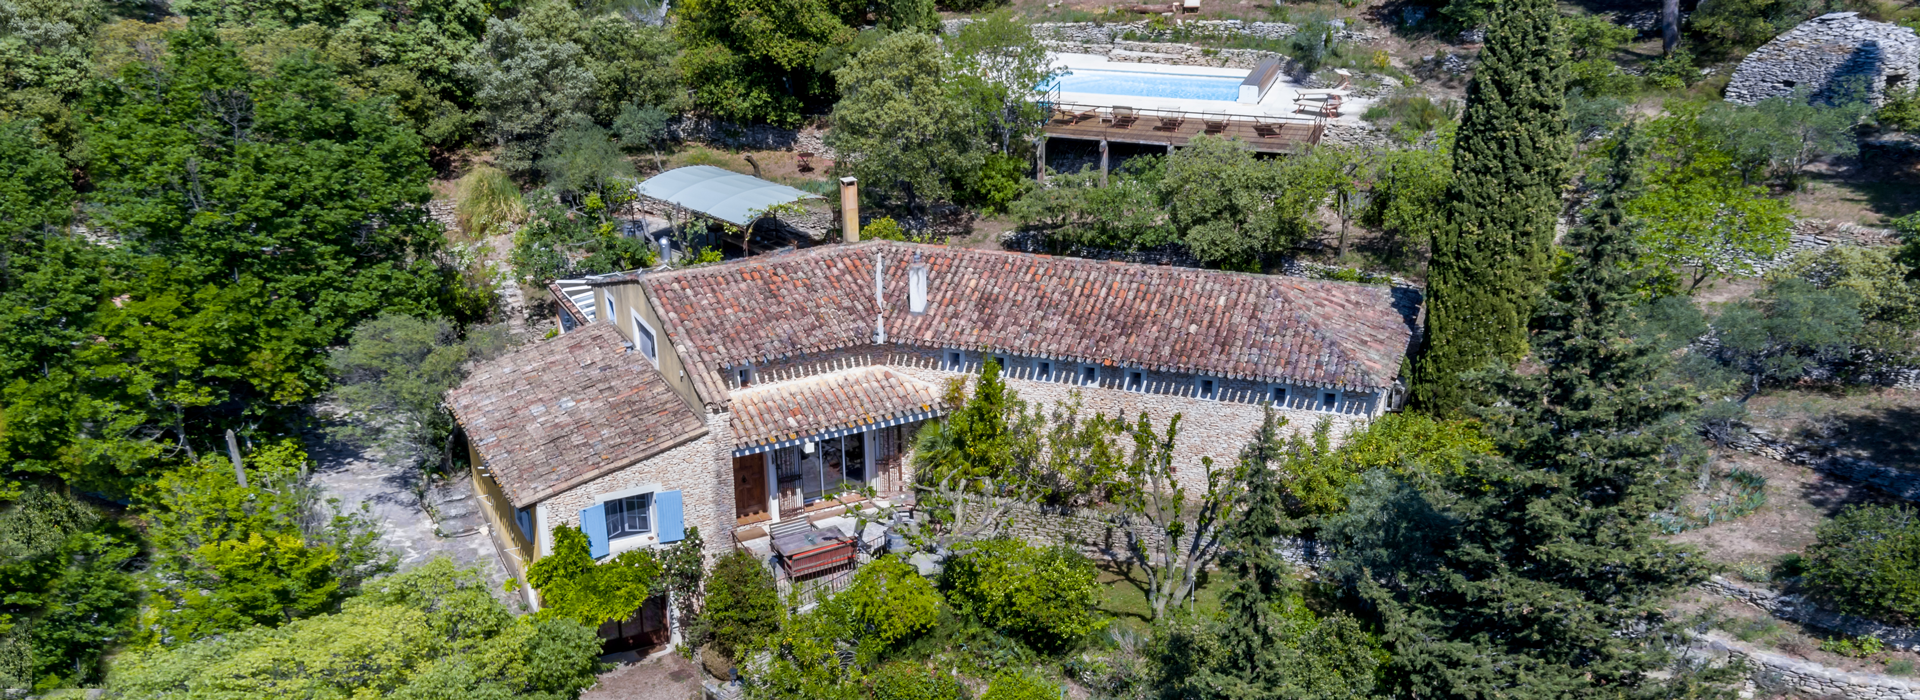
Vous accédez à l’entrée principale de la maison par un escalier en vieilles pierres et une terrasse à l’ombre d‘un murier parasol
- Une Grande pièce de vie de 69m2 très lumineuse vous accueille avec sa cuisine américaine et son bar, une arriere cuisine composée d'une buanderie-cellier et cave a vin, un salon cathédrale avec plafonds à la française, Poêle à bois scandinave et baby-foot de bar,
- Une véranda salle à manger donnant sur le jardin en restanque et une fontaine - vos petits déjeuners et repas sur une authentique table de monastère!
- Une suite parentale 'RONSARD'
- WC, placards.
- Accès par escalier intérieur au SAUNA
à l'étage
Depuis le salon, l’escalier d’angle dessert à l’étage:
- 3 chambres - suite 'LILY' - chambre 'CHOCO' – et chambre 'NINA' ouvertes sur le jardin avec accès direct à la piscine
- Une coursive d’accès à la mezzanine composée d’une bibliothèque, d’un espace jeux enfants et à la chambre 'COCOON' préférée des enfants!
en rez de Jardin
Depuis l’arrière cuisine par l’escalier intérieur, ou directement depuis le parking par sa baie vitrée vous accédez à :
- La buanderie équipée d’un point d’eau, lave-linge et sèche-linge et d’un Frigo américain bien pratique lorsque vous revenez du marché pour stocker vos courses
- Un espace Sauna : SAUNA suédois 2 places et douche à l’italienne
Les extérieurs
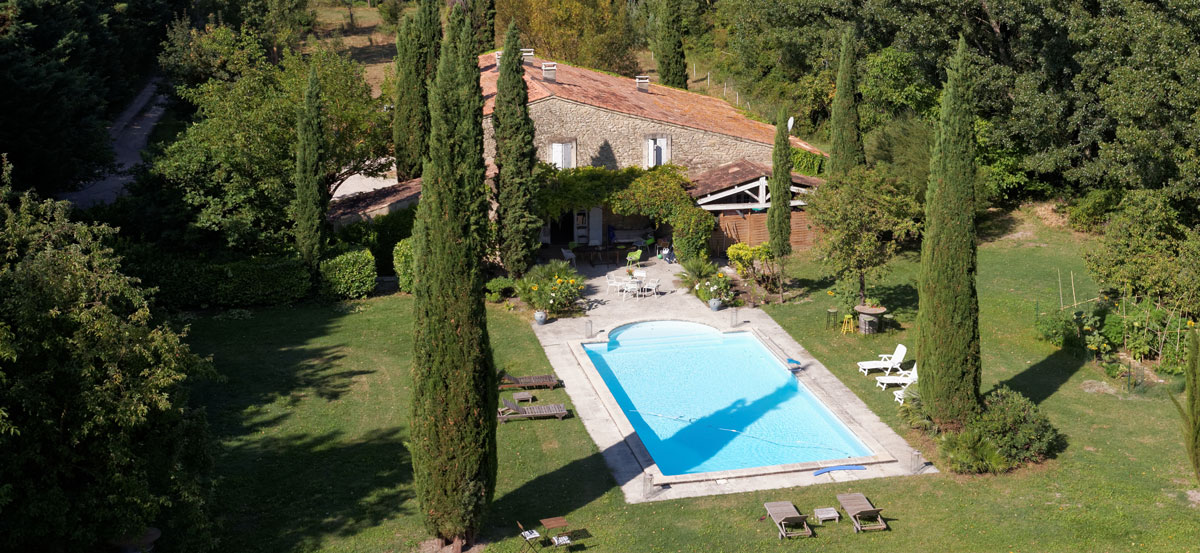
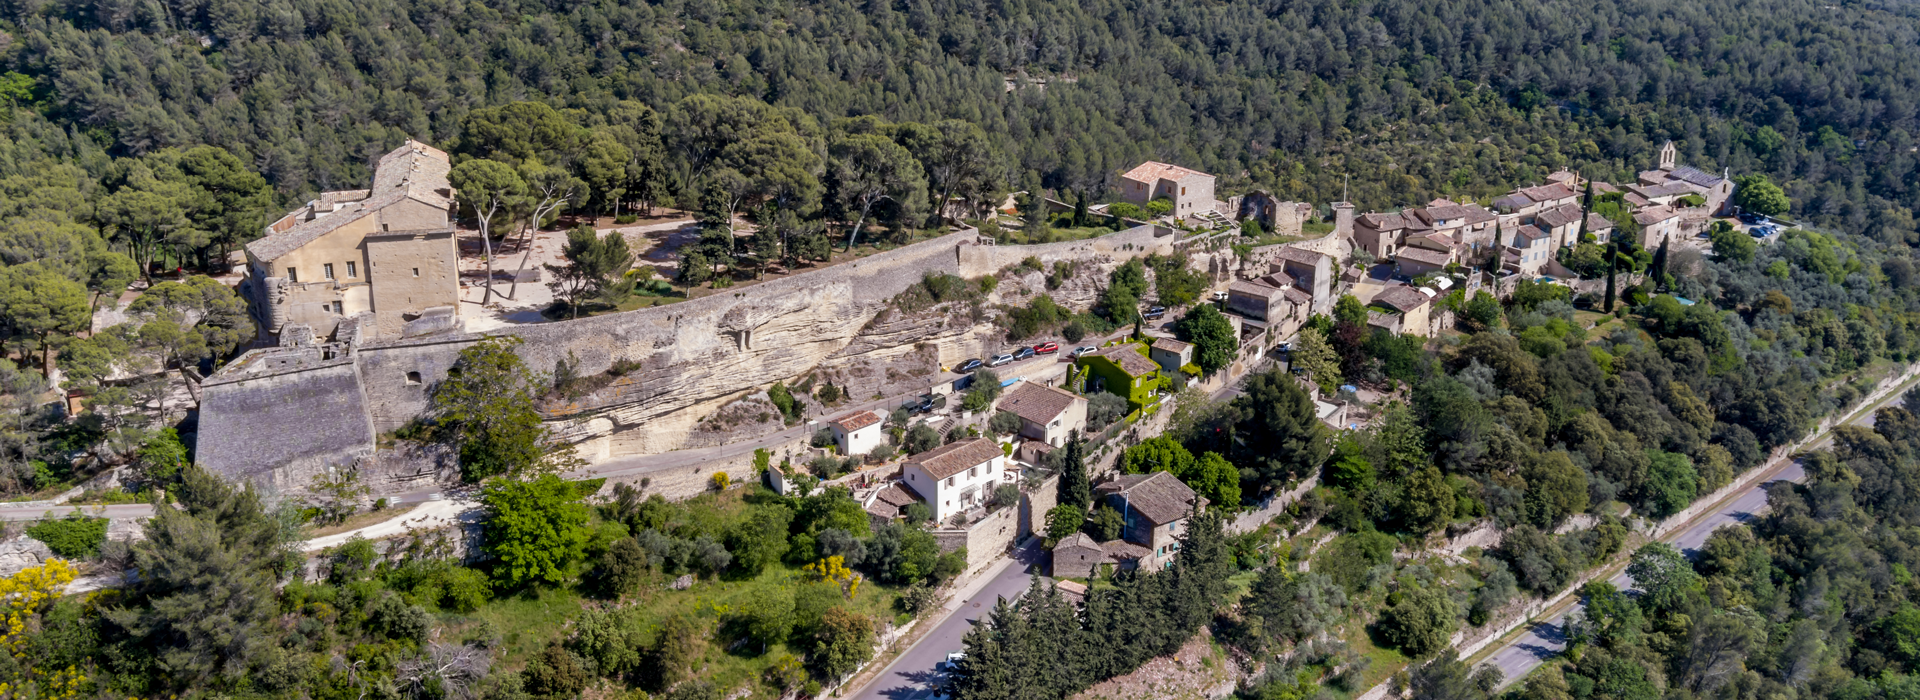
Aucun vis-à-vis, TRES BELLE VUE SUR LA VALLEE. Un jardin de 3300 m2 composé de terrasses et arboré d’oliviers, chênes verts, et autres essences méditerranéennes, avec jeux de lumière dans les arbres, la fontaine et les terrasses
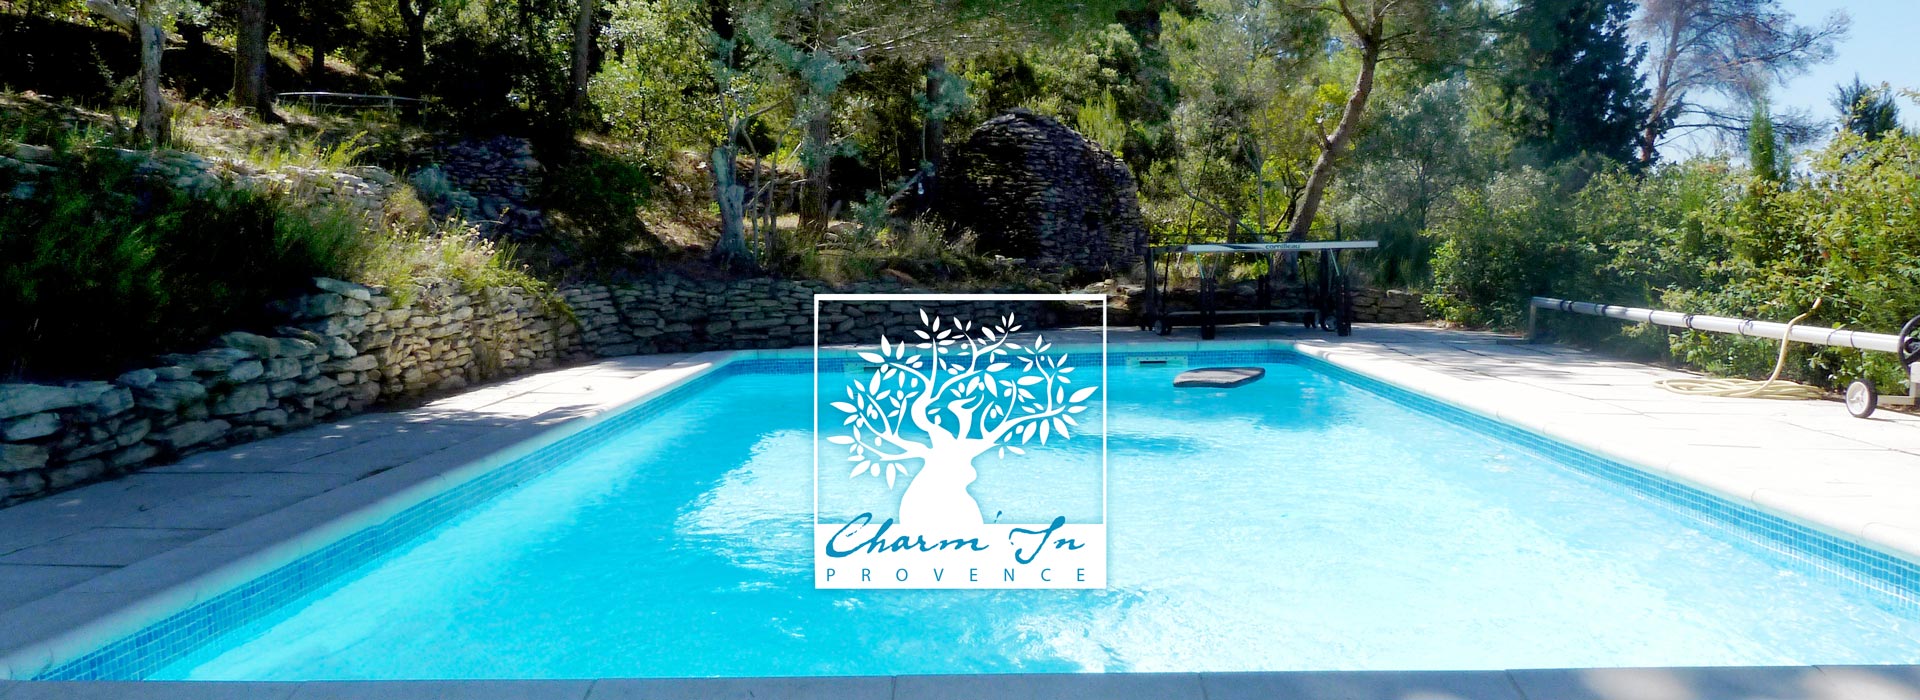
- Piscine au sel (pas de chlore) 8x4m-profondeur:1,10m à 1,70m
Piscine chauffée (pompe à chaleur) du 15 avril au 30 octobre : Baignades sans modération garanties de mai à fin septembre.
La piscine est équipée d’un dispositif de sécurité aux normes. - Chalet de rangement équipé d’un réfrigérateur-congélateur
- Espace ping-pong et jeux d'enfants
- Fontaine et terrasse sous les chênes verts
- Boulodrome
Au-dessus de la véranda, une terrasse sous tonnelle avec sa grande table pour 12 personnes et une plancha au gaz pour les traditionnels repas d’extérieur. Les nombreux espaces de vie extérieurs vous permettent de profiter de vos vacances sans se gêner avec de belles parties de pétanque endiablées autour d’un apéro de jour comme de nuit !
Les chambres
-
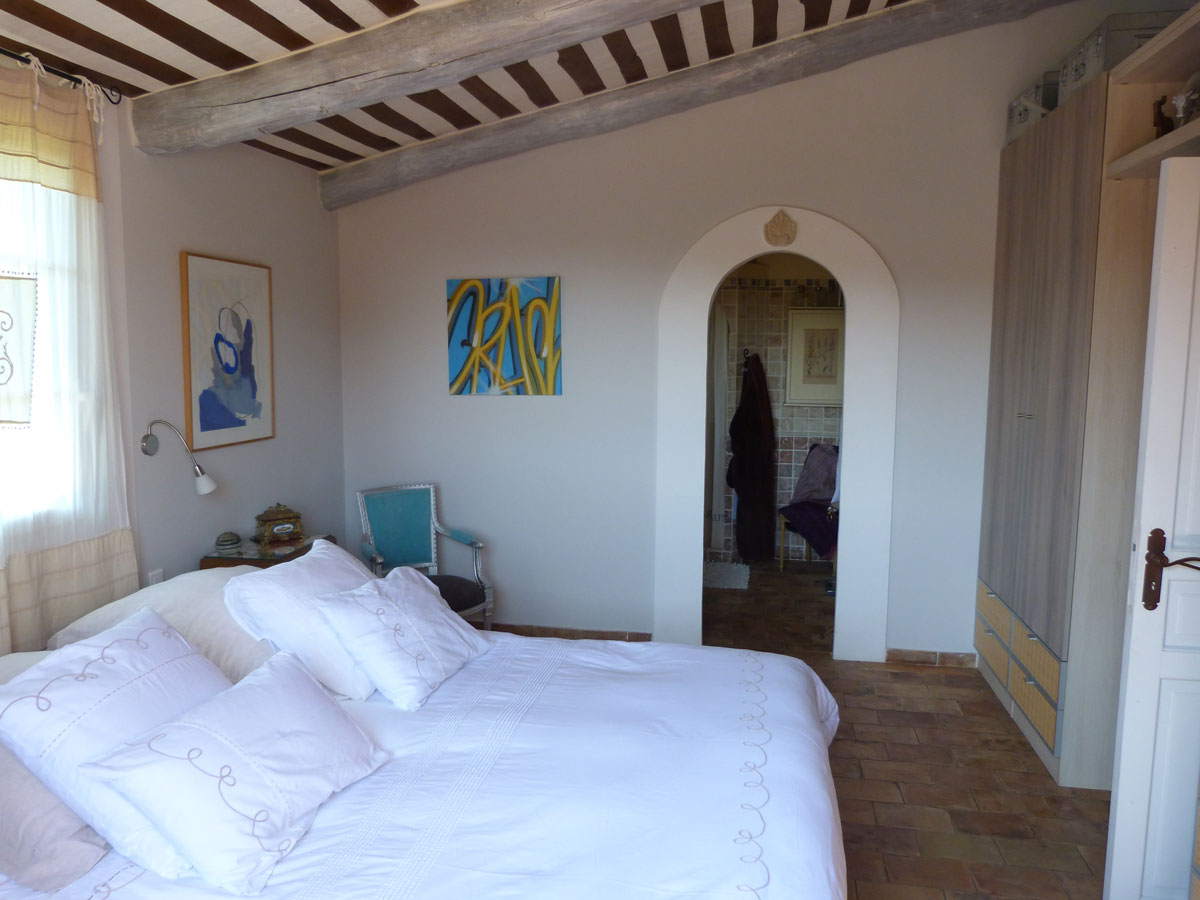
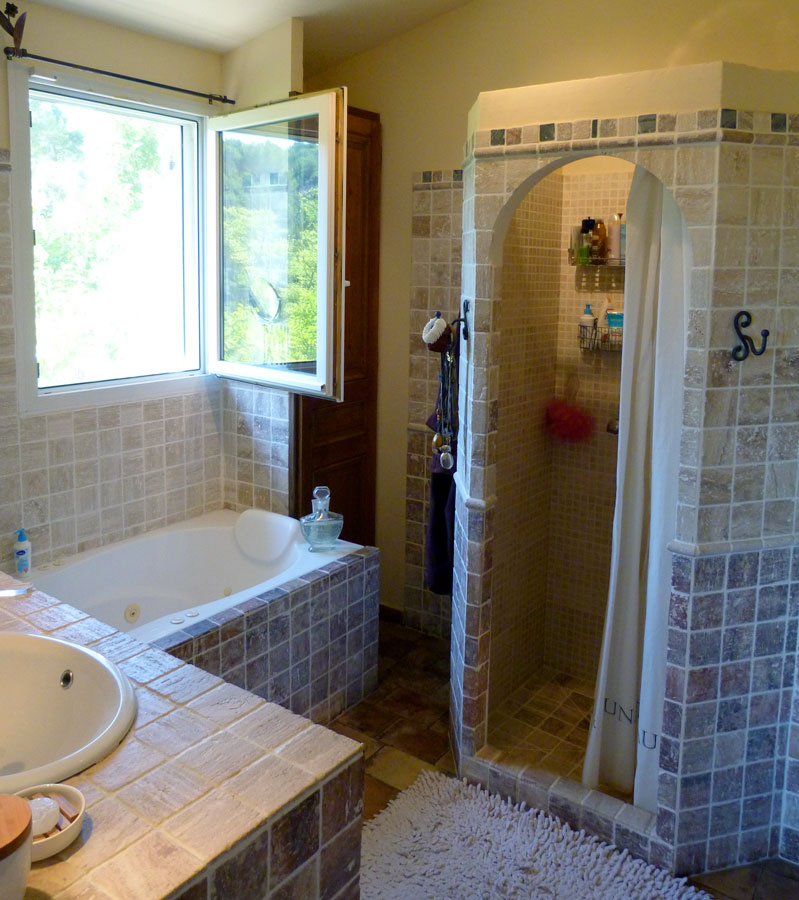
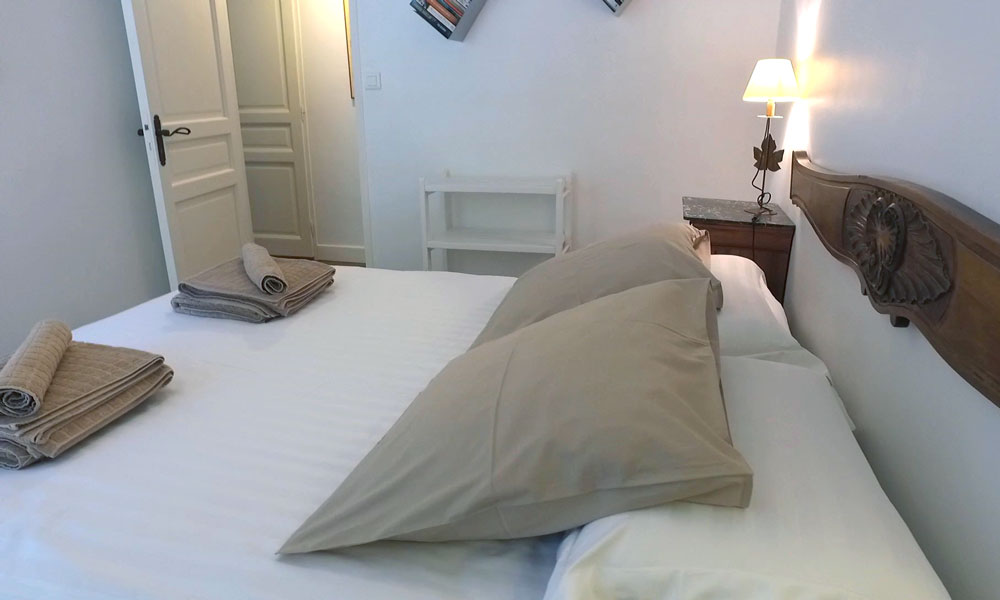
SUITE RONSARD : Suite de 24 m2, parfeuille au sol, plafond à la française, literie à mémoire de forme 180x190, salle de bain attenante avec baignoire-jacuzzi et douche à l'italienne.
- Grand dressing
- Fenêtres avec moustiquaires avec vue sur la vallée sud et ouest

-

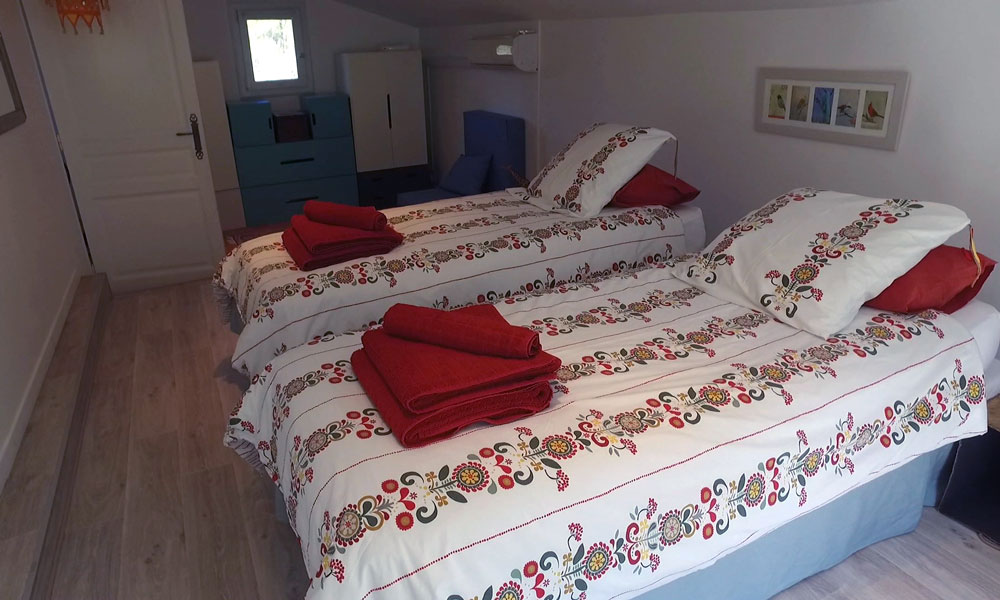
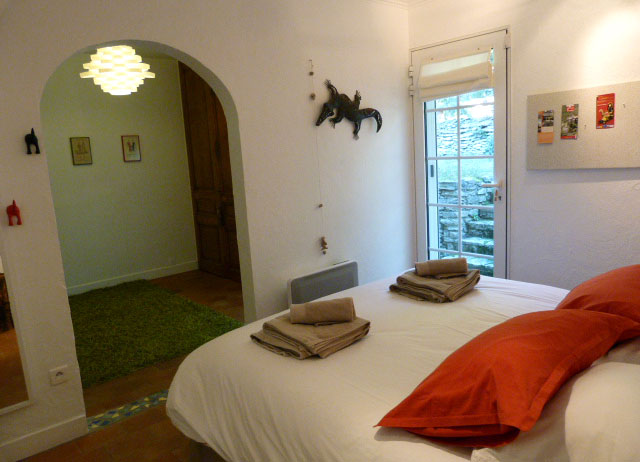
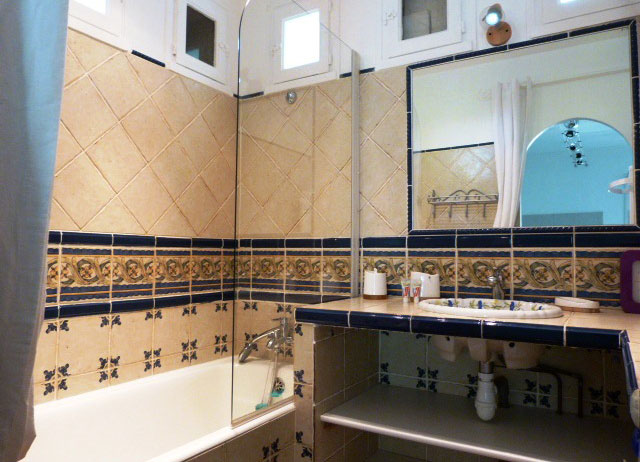
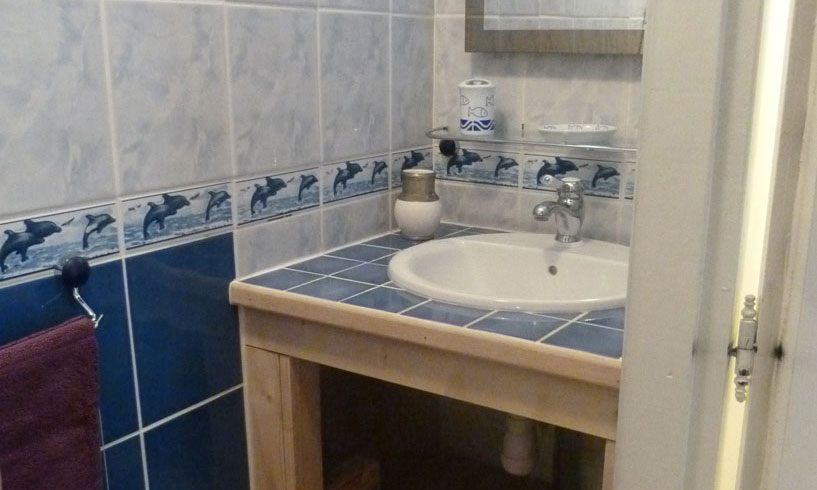
SUITE LILY : Double suite de 20m2, terre cuite au sol, literie a mémoire de forme 160x190 ou 2 lits 80x190, salle de bain attenante avec baignoire/ douche et WC séparé.
- Grand placard.
- Possibilité de rajouter chauffeuse dépliable ou lit bébé, idéal pour parents avec enfant en bas âge
- 2 portes-fenêtres avec moustiquaires ouvrant sur le jardin et accès à la piscine CHOCO
-
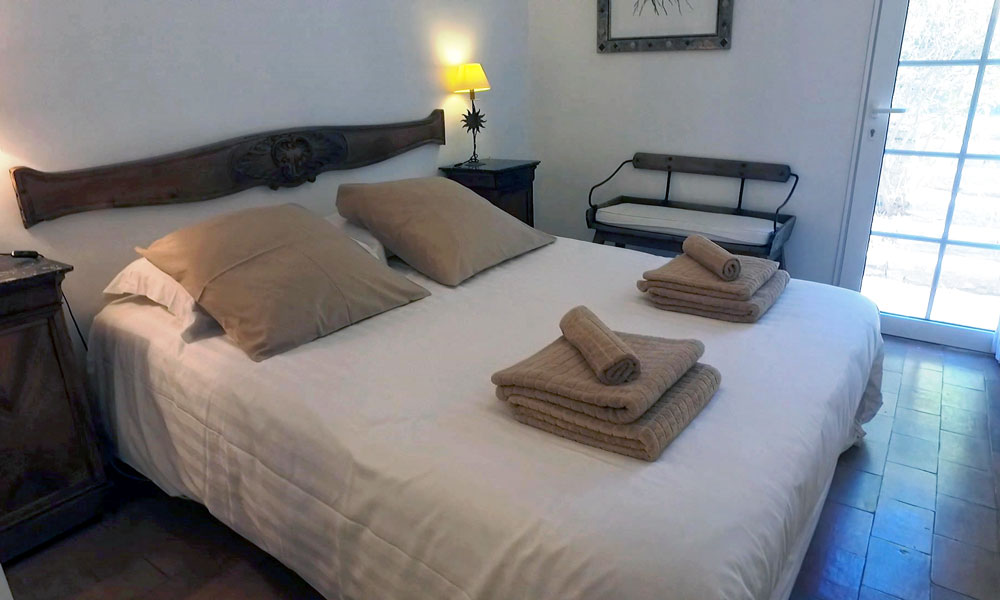
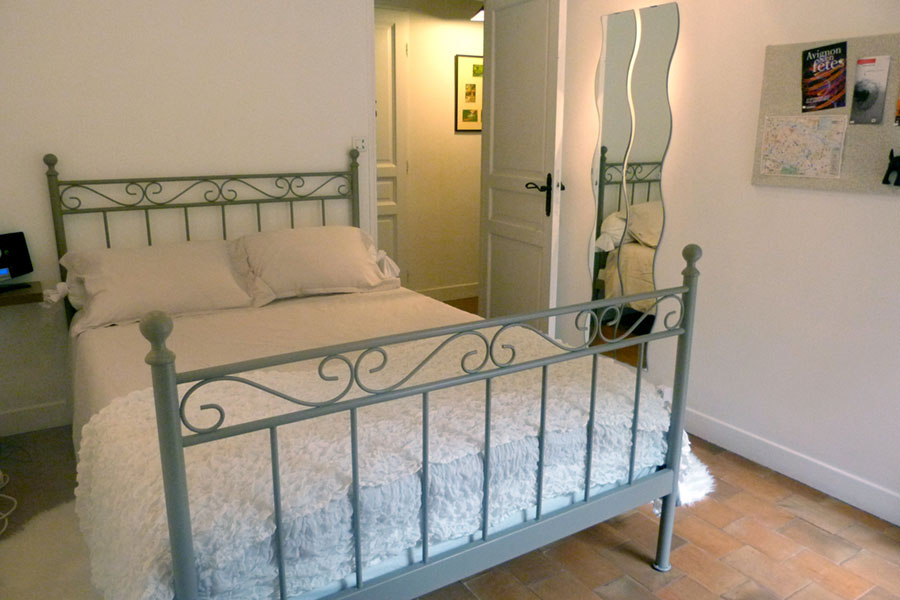
CHAMBRE CHOCO : 10m2, terre cuite au sol, literie a mémoire de forme 160x190 ou 2 lits 80x190, tables de chevet, banquette, étagères de rangement.
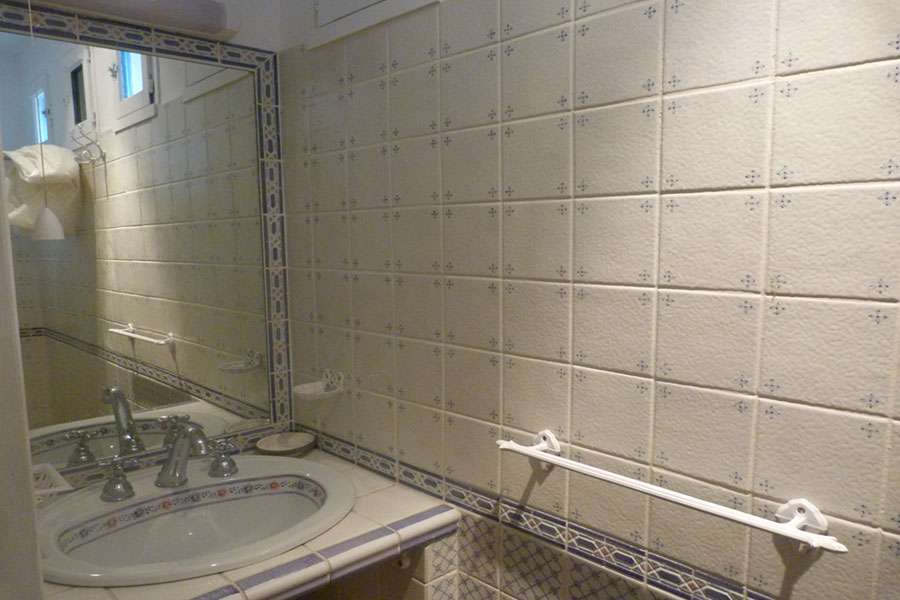
- Face à la chambre dans le couloir, penderie-placard et salle douche et WC séparé.
- 1 porte-fenêtre avec moustiquaires ouvrant sur le jardin et accès à la piscine
-
CHAMBRE NINA : 10m2, terre cuite au sol, literie a mémoire de forme 140x190, tables de chevet, semainier, et étagères de rangement.
- Face à la chambre dans le couloir, penderie et placard et salle douche et WC séparé.
- 1 porte-fenêtre avec moustiquaires ouvrant sur le jardin et accès à la piscine

-
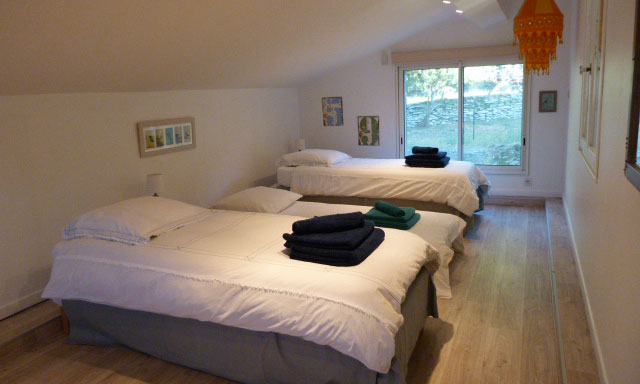
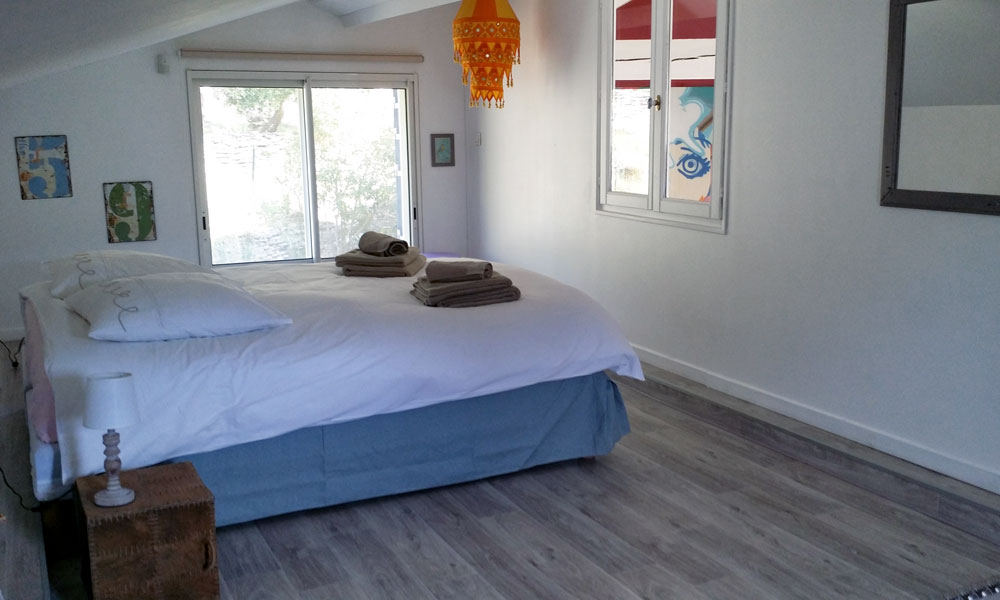
CHAMBRE COCOON : 20m2, mansardée et climatisée, literie 160x190 ou 2 lits 80x190 penderie-placards de rangement, Possibilité de rajouter deux chauffeuses 80x180
- jour traversant fenêtres avec moustiquaires ouvrant sur le jardin et la piscine